This page showcases the monthly statistics, which is derived from the ANNA Service Bureau (ASB).
As of 1 July 2026, these charts illustrate the Statistics related to ISIN allocations, coverage and growth, which are based on data derived from National Numbering Agencies that are ANNA members and partners. Each chart highlights a specific overview of key trends for users to better understand patterns related to ISINs.
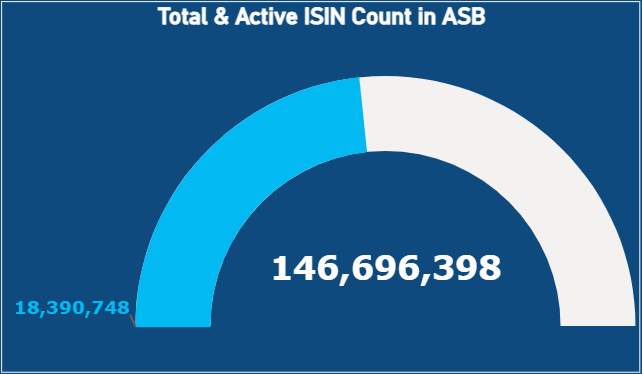
This chart displays the total number of ISIN records maintained in the ASB and the subset of ISINs that are currently active.
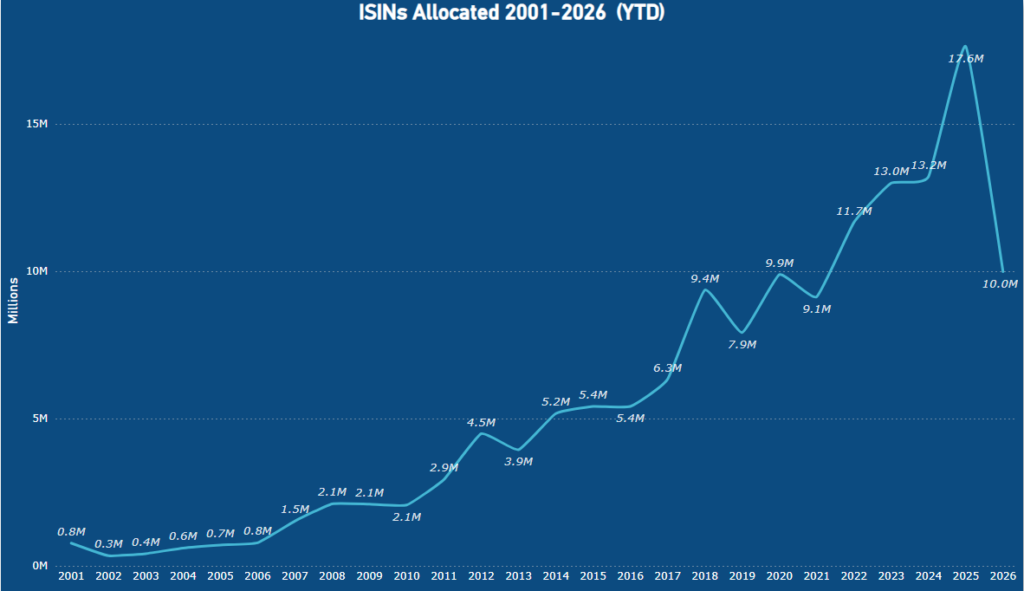
This line chart is the number of annual allocated new ISINs annually as of 2001 to date in the ASB.
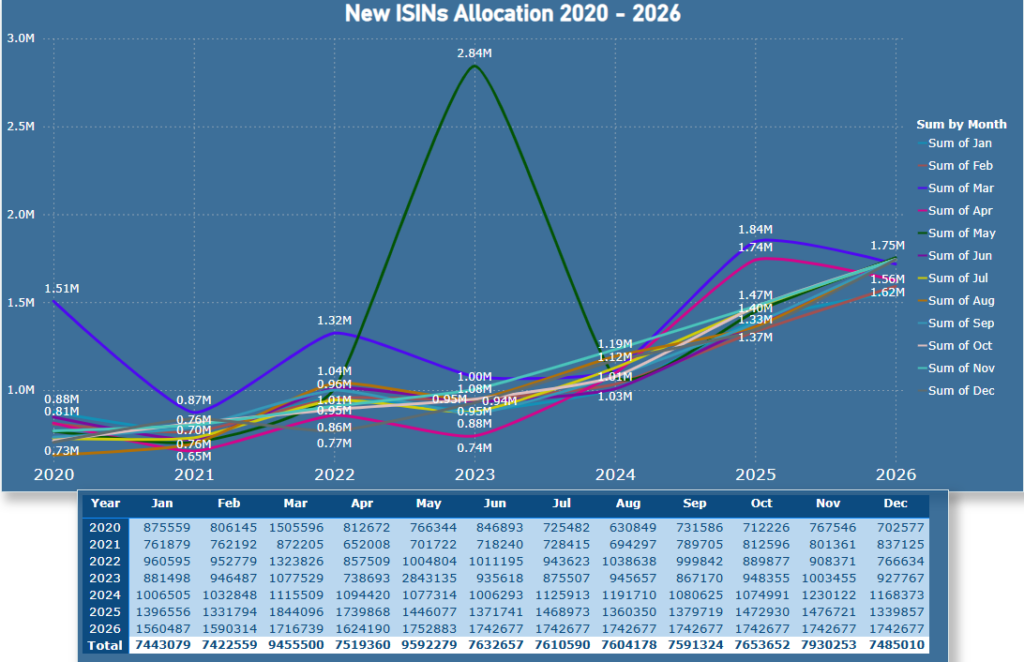
The chart shows the monthly volume of new ISIN allocations from 2020 till date. It provides a year-by-year comparison of allocation activity, with detailed monthly figures displayed in the table below.
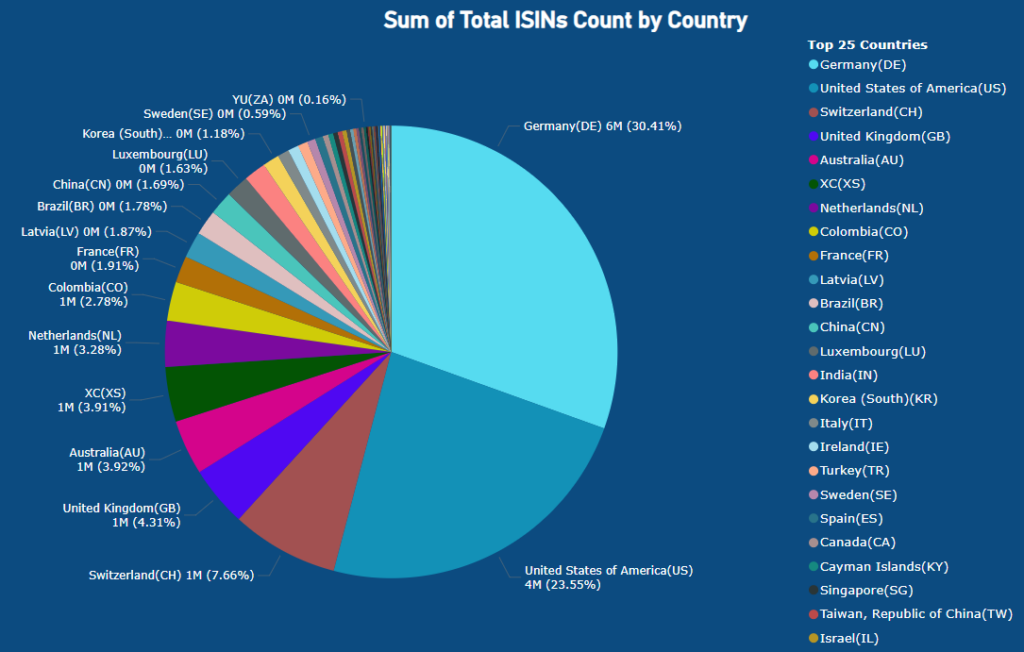
This pie chart is the number and relative percentage of total ISIN by country in the ASB
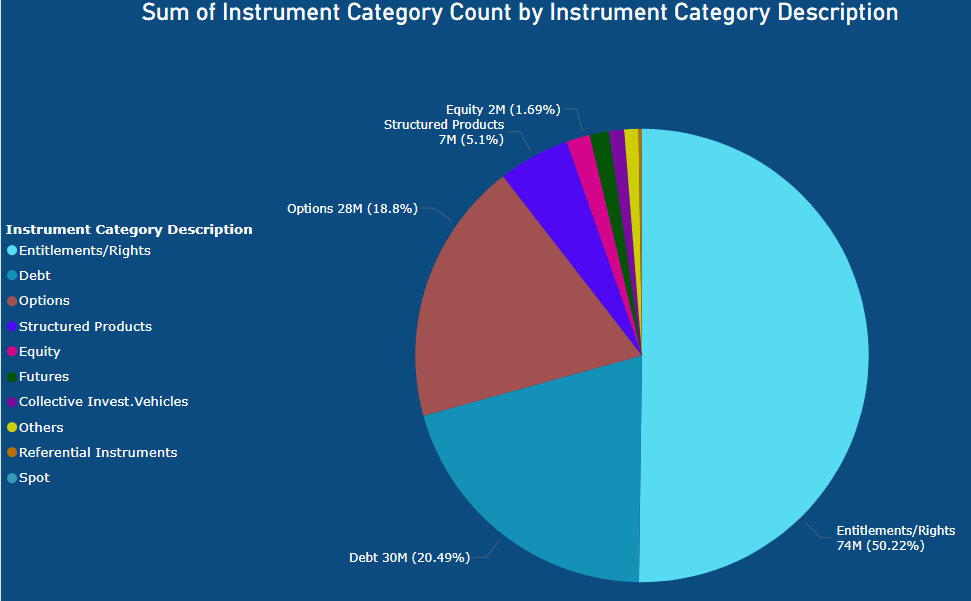
This pie chart is the number and relative percentage of Instrument Category by Description in the ASB
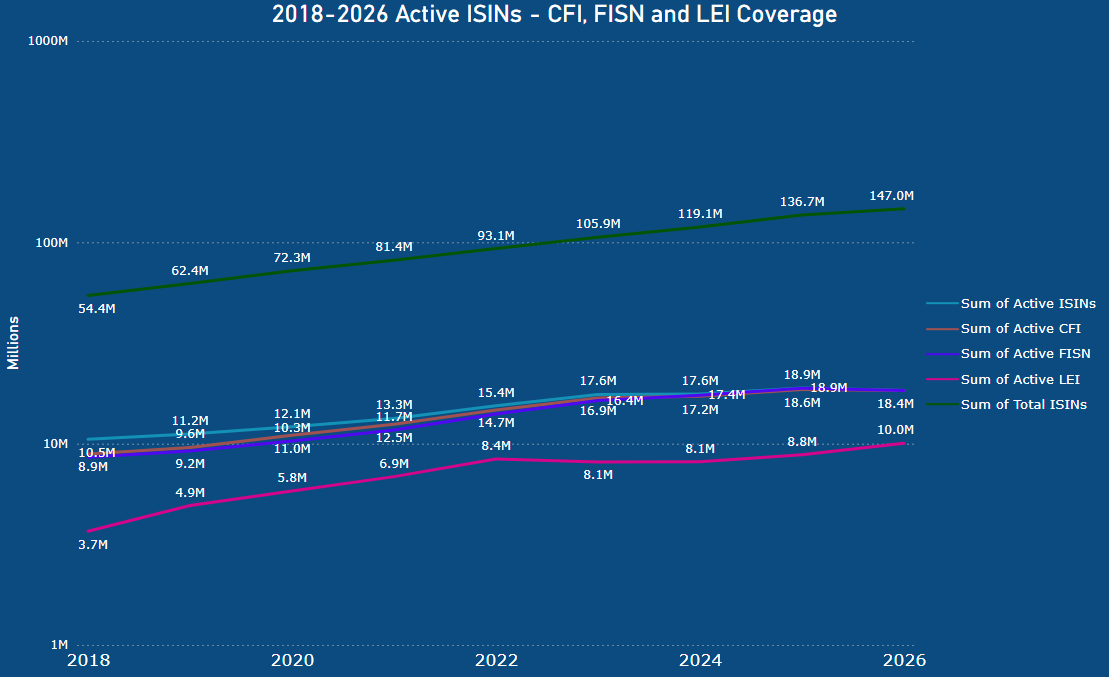
This chart shows the number of active ISINs in the ASB and the availability of associated CFI, FISN, and LEI identifiers between 2018 to date.
This chart shows the monthly totals of active ISINs and total ISINs maintained in the ASB between 2020 to date, together with the corresponding monthly data table

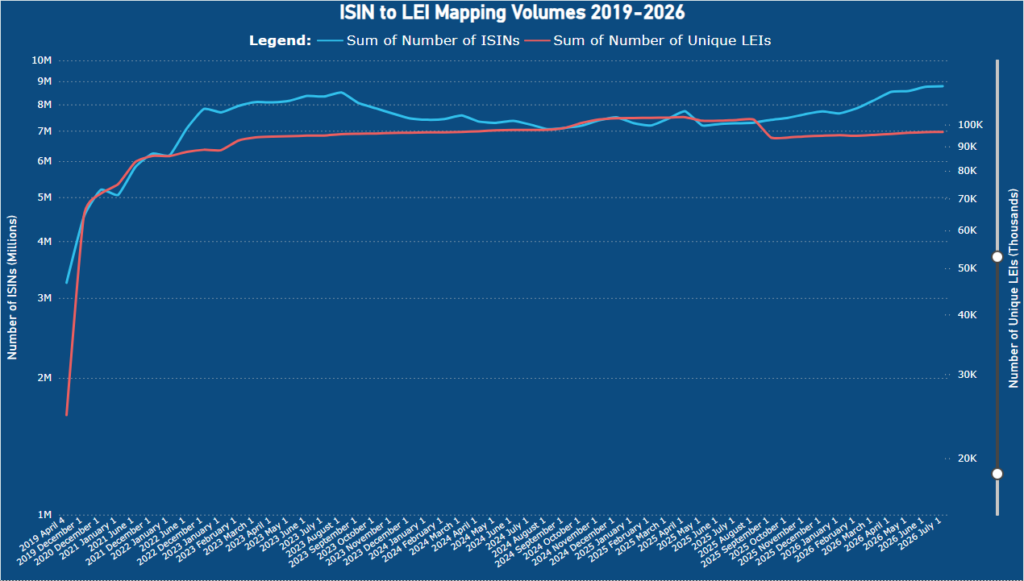
This chart presents the monthly number of active ISINs and unique LEIs included in the ANNA-GLEIF ISIN:LEI Mapping Initiative between 2019 till date. Click here to read more about this initiative.